Working with technology and analytics data collection throws up all sorts of interesting challenges and emotions. One such time which is always at risk of throwing you a few curve balls relates to production deployments.
I’m not only talking about times where you are releasing some new/updated digital marketing tags to your site but also this can occur when your site itself is undergoing some changes of which you may not have even had any direct involvement in.
Sure, you may have ticked every box in your testing procedures and (if you’re at that stage of your analytics maturity) you may have even validated that all your automated test cases are working as expected, but there is always the small possibility that once a change is deployed to production, something can go wrong which you would have had no way of knowing about.
It is not uncommon that something in your data may have been impacted by a release that you aren’t even aware of. Some examples could include:
- a change made to a registration flow may inadvertently cause errors for a particular browser type
- a change to one of your product pages that may no longer allow users to complete the flow if entering the site directly via that page
- a change in format of a key data layer attribute may result in specific rules no longer triggering
There is no doubt that proactive prevention is better than reactive resolution, however you must factor in to your analytics processes a step to look out for things that you wouldn’t otherwise think to look out for.
Adobe Analytics Analysis workspace has a feature which can greatly assist you with this task. It’s called Segment Comparison.
The good news is that this is very simple to run, with very few steps required.
Step 1 – Create two segments
i) The first segment should be created as follows:
Title : Single Hour – Pre release
Definition : Include: Hit, Dimensions: Hour = [select a specific hour from exactly 7 days prior to your site/tag release]
ii) The second segment should be created as follows:
Title : Single Hour – Post release
Definition : Include Hit, Dimension Hour = [select a specific corresponding hour from exactly 1 full hour after your site/tag release]

Note – It’s important that the individual hours you choose are from the same time of day. E.g. 3pm – 7 days before your site/tag release, and 3pm on the day of/after your site/tag release.
Step 2 – Analysis Workspace Segment Comparison
i) Once you have created your segments, start a brand new Project in Analysis Workspace.
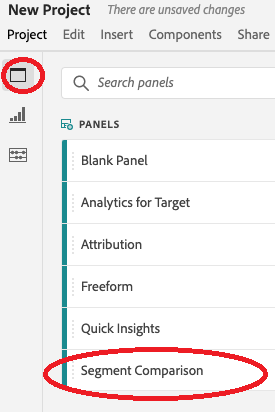
ii) Select the Panel tab within the left hand rail
iii) Drag across the Segment Comparison Panel to the main workspace area
iv) Click back to the Components tab and search for your two segments created in Step 1 ‘Single Hour’.
v) Drag each segment that you created in Step 1 into the ‘Add a segment’ sections of the workspace panel
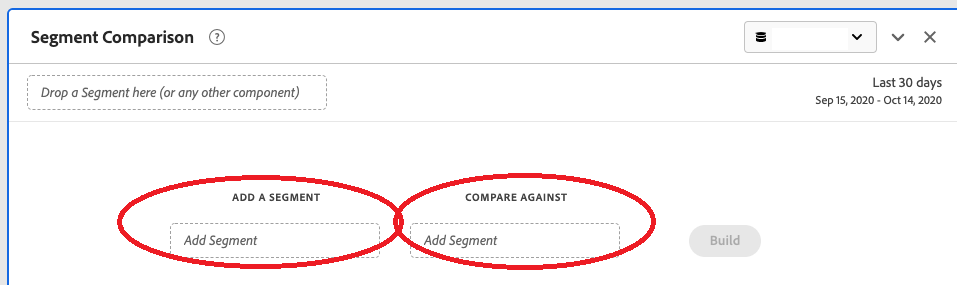
vi) Click Build (this may take a few minutes to complete)
Step 3 – View and refine your results
When you click Build, the tool will scan all of your data (segments, metrics and dimensions) over the two specific time periods defined in your segments.
After a few minutes you will be presented with some tables highlighting the differences detected across all of your data. This is where you should look out for any unexpected changes immediately after your release. Are there any major shifts in technology related dimensions or entry page dimensions – or anything else that stands out?
If something doesn’t look right, this should be your trigger to investigate further.
Tip 1 – The first time you run this Segment Comparison, you will likely see dimensions being highlighted that you would completely expect to see, for example, Tag Version dimensions time based dimensions such as week/month.
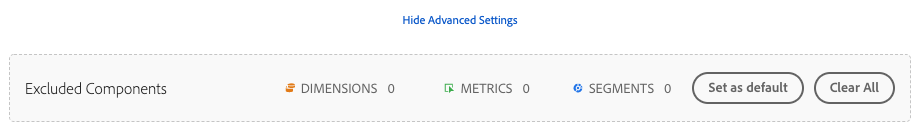
When defining the Segment Comparison, you can click on ‘Advanced settings’ and define a list of dimensions/metrics/segments to exclude from the comparison.
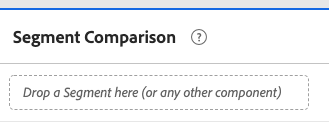
Tip 2 – You can also apply an overarching segment at the top of your Segment Comparison panel to limit the data even further, for example you may want to limit the comparison to users who have performed a search, or first time or return users.
Summary
You can never be 100% certain going into any sort of production release that everything will go as you planned.
Often people will only discover issues that have been introduced well after the release, either in their weekly reports or worse after they receive customer complaints.
But by using some of the tools you already have at your disposal, you can get ahead of the game and use the technology to do the grunt work for you to identify potential areas of concern.
Recent Comments