Quite often in the course of managing and maintaining an effective digital analytics and marketing program, there is a need to audit, at a very granular level, exactly what data has been captured for a particular user or transaction.
This need could be because of a specific customer complaint or query, a need to inspect common flows of users experiencing a particular error or site issue or perhaps even just to validate the data collected from your own testing.
Either way it may not be immediately obvious to you how you can achieve this in Adobe Analytics. Some of the challenges to overcome using Analytics Workspace are:
- It is difficult to view many data points from a single page in the same table
- If you are trying to segment a particular visit by a variable with high cardinality (lots of values), you may run into the dreaded low traffic (uniques exceeded) issue whereby your segment will not work in Analytics Workspace
- It is difficult to clearly see the flow of hits and pages a user has undertaken in your specific visit
The answer to all of this is a very effective but often forgotten tool in Adobe Analytics, the Datawarehouse.
The User Interface for Datawarehouse may not be as slick or fresh as Analytics workspace, however the functionality this tool offers is very powerful and provides a solution for this very problem of being able to narrow down the granular detail of a specific visit.
So how can you do this?
Step 1 – Create a segment for your specific user
This is relatively straightforward, assuming that you have one of the following in place:
- an eVar or prop setup to capture a transaction identifier or booking reference that you want to investigate
- an eVar or prop setup to capture specific hashed customer id
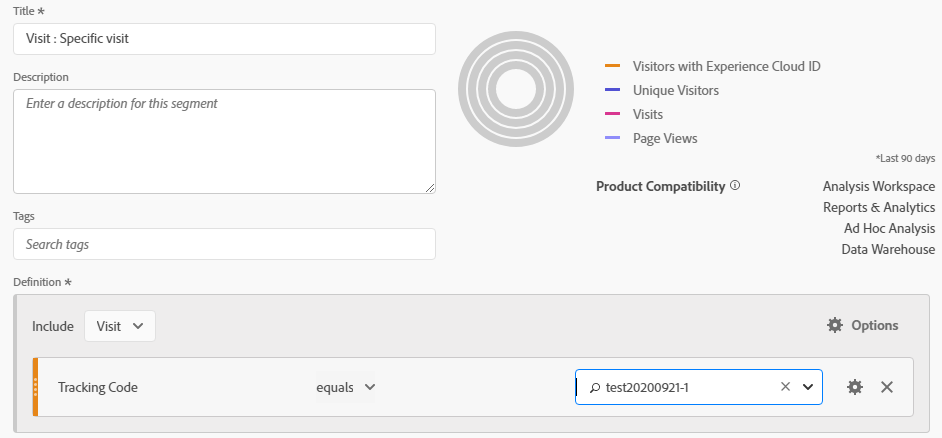
- a eVar or prop setup to capture the value from query string parameter, thus allowing you to use a unique code in your URL to identify your particular visit. For example, you could visit your site with a unique query parameter such as via this link (example only) www.yoursite.com/?cid=test20200921-1
Once you have identified the attribute in your data that you can use to identify the visit(s), you need to create a Visit based segment based on this criteria such as what is shown below.
Step 2 – Setup your data warehouse request
If you’ve never used Datawarehouse before, you can find it via Tools > Datawarehouse. As mentioned previously the User Interface is a little dated, but fear not, the functionality available here is very powerful.
To build your Datawarehouse request, you need to undertake the following…
- Give your request a meaningful name.
Tip… there is also a feature where you can look at your past Datawarehouse requests and duplicate them, so by providing them with a meaningful name will assist you down the track in case you wish to run a similar request again in the future. - Select the timeframe either via the calendar is a preset list of choices such as yesterday, last 7 days.
Tip… if you choose a timeframe which includes the current day, for example this week or this month, or today – the report will not start executing until that period has fully completed.
Tip… you should choose as small a window of time as possible, as this will mean you get your data returned faster
- Select the granularity of the data you want returned, I would suggest you choose hourly for this use case
- Select the segment you want to narrow down your data, this should be the segment you created in Step 1 which will limit the data returned to the specific visit or user with which you have identified.
- The next step requires you to select the breakdowns (dimensions) and metrics that you want to include in your report.
This is where the ability to report on individual visits really kicks in.
Start your request with the following breakdown items from the standard set of options:
- Experience Cloud Visitor Id
- Visit Number
- Clicks to page
- Pages
- Custom Links
- Page URL
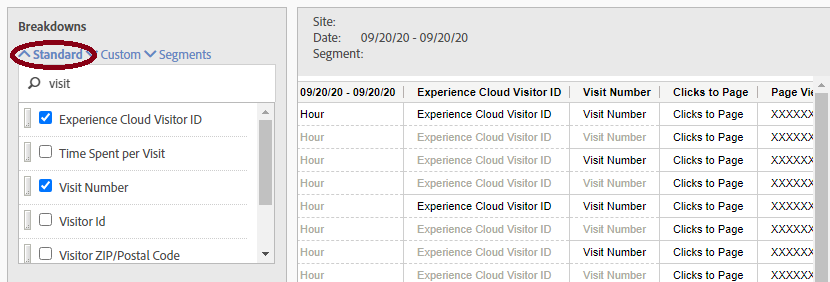
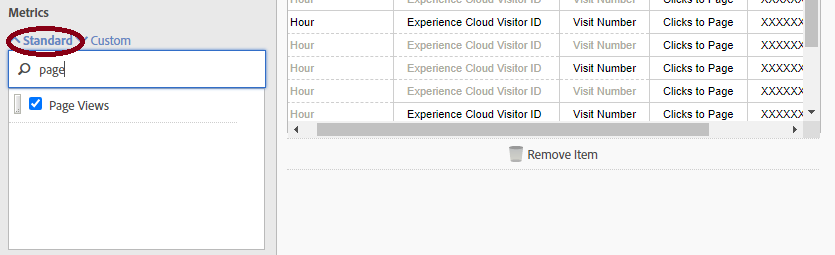
Next add in some basic metrics from the standard set of options, such as:
- Page Views
- Visits
Note – you can add in any additional custom breakdowns and metrics as you see fit.
- Setup your delivery options
If the segmentation option you applied to the Datawarehouse report settings has been successful in limiting your dataset to a single visit then the csv results file will be small enough to send via the email delivery option.
Otherwise, datawarehouse result files can get quite large so an FTP server may be required to deliver the csv results to.
Summary
By configuring the set of dimensions and metrics outlined above, your csv results data will contain a single line of data in your csv file for each hit of data received from your chosen visit.
Importantly the ‘clicks to page‘ dimension shows you the order with which they were received, and in conjunction with the page and page url (and custom link) dimensions you can see the flow of a visit throughout your site.
Some other helpful dimensions to consider including are:
- Referrers
- Last Touch Channel
- Last Touch Channel Detail
- Exit Links
- IP
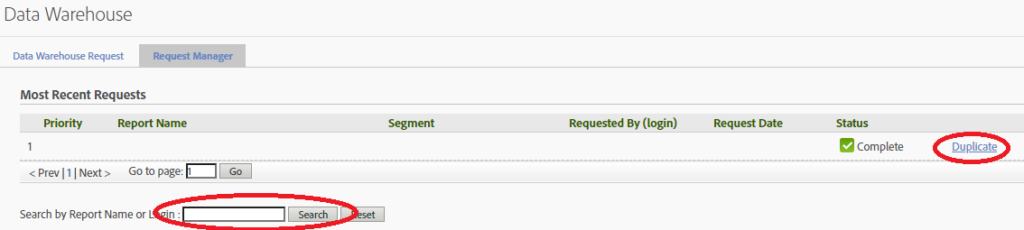
Tip… if you need to find a request you have run in the past so that you don’t have to build one from scratch again, you can use the Request Manager tab to search for and Duplicate an existing request.
To close out this article, the Adobe Analytics Datawarehouse can be very powerful in providing access to the data collected on your site in a unique way. There is no doubt the User Interface could do with a refresh, but once you understand how to build the queries you require, it can form a very powerful tool in your analyst toolkit.
Recent Comments